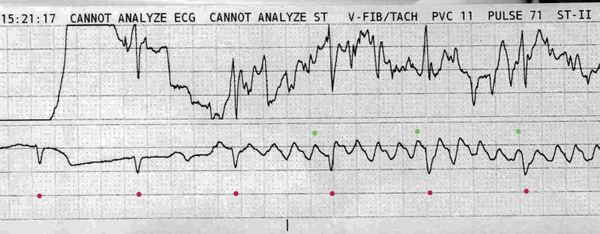
?sinus rhythm with movement artifact
From across the room it looks like the onset of some wide complex tachycardia. This would be a good time to look up and see if something just changed with your patient!
Discussion:
On a closer look, we see that the initial narrow-complex rhythm tracks through the new ‘tachycardia’.

The magenta dots show the regular sinus rhythm at around 70 bpm, with continued deeper negative deflections in the bottom lead. The upper lead is harder to interpret, and only with a long strip is it easy to pick up the pattern based solely on the upper lead.
But wait- that bottom lead is so regular. Is this atrial flutter with a 4:1 block? It looks like F waves at ~300 bpm.
Nope. If this was a conversion to flutter we would expect the overall rate to at least change a little, but this one tracks right through. So: there are no F waves. What we do have is movement artifact from a respiratory therapy bed superimposed over a regular supraventricular rhythm. The bed was turned on a few seconds into the recording of this strip.
Note that the ‘F waves’ are out of sync with the ventricular depolarizations. The green dots note the last wave before contraction, and if we continue to watch the strip it will show no regular correlation. This can happen in flutter when there is decremental delay in the AV node (Wenckebaching), but generally flutter will show regular correlation from F waves to QRS complexes.
Here is the next strip from that bed:
Looks like VT right? Especially in the upper lead. Note that the lower lead is a chest lead (marked ‘V’) which is less affected than the upper lead (II). Lead II runs from the Right Arm (RA) to the Left Leg (LL). Perhaps the bed is bouncing one of those extremities around a lot, assuming one or both of the lead II electrodes is attached distally.
You could be forgiven for calling atrial flutter based on this strip. It really does look like it. As before you can track the sharp deflections that correlate with the patient’s true heartbeat through the strip again, but this wouldn’t rule out atrial flutter with a 4:1 block- not that uncommon an entity. The upper lead shows such enormous deflections with what would be the flutter waves that you might be tempted to call ventricular flutter, but you can pick out the actual ventricular QRS complexes. You might say the lower lead looks just like atrial flutter, but further inspection shows they eventually get out of sync, and more importantly: the amplitude on the upper lead is way too high, so this couldn’t possible be an atrial baseline even though the gain has been increased to 1.5x as seen in the calibration mark.
One last strip from the same patient:
This is a tough one to make anything out of. The upper lead is unintelligble, and just looks like classic movement/loose lead artifact. The lower lead holds together more, and shows a regular ‘flutter’ that would have me sweating if I didn’t have clinical context or another lead to look at.
If you really work at it, you can pick out the underlying rhythm (marked with magenta dots below) in the first half of the strip:
However, it’s pretty clear this is a bad print. If your patient was hypotensive and had lost mentation for any reason and the monitor reads this, the defibrillator would happily sync to the artifact. Sure- you’d turn the bed off and realize your error first- but the point is that any number of things (including electronic devices in the area) can cause tempting artifacts and you must be wary.
Final Impression?
Regular narrow-complex rhythm (presumably sinus but can’t verify from this strip) with movement artifact.
Management implications:
None right now. I suppose you could turn off the bed to verify your interpretation. If the monitor is giving you VF alarms every ten seconds, you could change electrodes to more central placements to avoid as much movement artifact as possible, but it will be hard to dispel completely.
The Take-home Point:
All kinds of things cause artifact. Treat the patient, not the monitor.
![]() A two-star strip. The meat and potatoes.
A two-star strip. The meat and potatoes.


